
Ever since Azure Monitor Logs Ingestion transformations came out, I had a theory on splitting the logs into different tables from the same data source, but in reality I’ve never tested it and never seen any one do it.
Lets start with the reason why.
In Microsoft Sentinel and Azure Monitor, analytic logs are the all singing, all dancing logs with regards to functionality, but they are also the most costly. Basic logs offer an alternative where you can collect logs at a much reduce rate, but with limited functionality, these are ideal for logs like, net flow logs which have a low detection value, but may be used as part of an investigation if the threat requires it.
There are scenarios where organisations want to collect data into Microsoft Sentinel to perform detections, but only require a subset of that data that is ingested into the analytics table, the rest of the data they may want to collect it, but not pay the premium for it.
Here is a common example I see, take the table AADNonInteractiveUserSignInLogs from Microsoft Entra Id (formerly Azure Active Directory). Every sign in that is logged in this table has details of every conditional access policy in your organisation and it’s evaluation status. For some customers, the conditional access policy column accounts for a large portion of their ingestion data and they have either filtered the column out, or bit the bullet and accepted the cost. Why don’t you check the column sizes yourself using this query. This query gets the size in bytes for each column over 1000 rows. You can modify it easily for average sizes, total sizes or other tables.
AADNonInteractiveUserSignInLogs
| take 1000
| evaluate narrow()
| extend ColumnSizeBytes = estimate_data_size(Value)
| summarize ColumnSizeBytes = make_list(ColumnSizeBytes) by Column
| extend series_stats(ColumnSizeBytes)
| project-away ColumnSizeBytes
So how do we solve this.
We do this by sending the data to multiple tables, one analytics and one basic, but filtering the data before it is ingested into each table.
In the animated graphic below, we have a log source (I’ve tested Security events, Microsoft Entra Id and M365 Defender Tables), the data collection rules splits the data and the transformation going to the analytics table reduces the data, which will reduce costs, while the raw data is sent to the basic table.

To keep it simple, I’ve create a workbook which will step you through the selecting the table, creating the transformations and either deploying directly, or just generating the ARM template. It has a step by step help to guide you through using it, or you can follow the steps here.
Workbook Steps
1. Deploy the workbook from my GitHub repo. (I will get this into the gallery at some point).
2. Select the Subscription and Workspace.
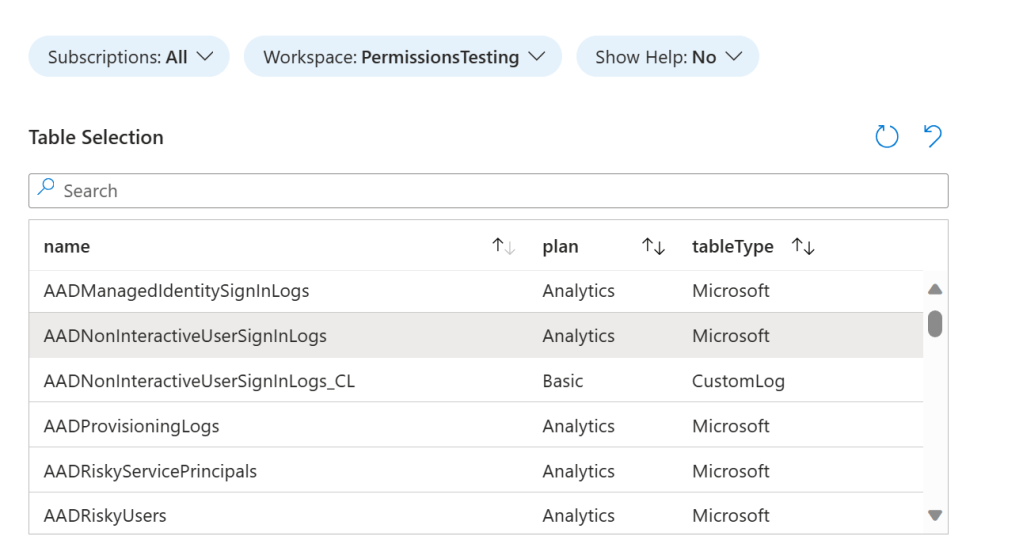
3. Select the table from the Table Selection grid view.
3. All columns by default from the selected table will be transferred, however there are some standard ones are reserved by Microsoft and others you may not wish to create, you can filter them out using the Show Filtered Columns Parameter and updating the JSON array.

4. Observe the table schema that will be created on the new custom table.

5. The new custom table name parameter will be populated with <SelectedTableName>_CL, if the selected table is a Microsoft Table. If it is a custom table, it will be appended with _COPY_CL. You can change it to a name of your choosing, but it MUST end with _CL.
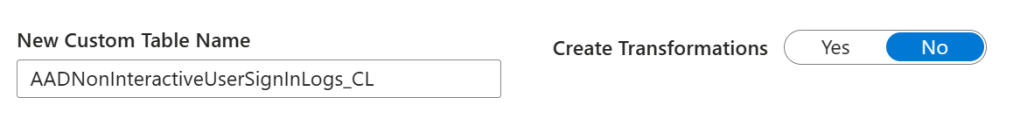
6. Optionally, you can create transformations, you can change these later if you want.
7. The UI will display two areas for creating the transformations, the top selected table, is the table you selected previously. The logs shown are from the current selected table.
NOTE: If the table already has a transformation in place, the results will be different. Either delete the existing transformation, or merge it with this new transformation.
NOTE: If the selected table is a basic table, then the results will not be displayed in the workbook, this is due to the reduced functionality. You will need to follow the next steps.

8. You can click the “Open Workspace Editor” button to create the query in the logs blade, it will populate the current query with source commented out, and the selected table in it’s place. This is because the logs blade does not recognise source as table.
If you have selected a basic log table, there will be a cost incurred for running queries across this data.
Ensure your query adheres to the limitations listed here. https://learn.microsoft.com/en-us/azure/azure-monitor/essentials/data-collection-transformations-structure#supported-kql-features

Once done, copy and paste your code into the text parameter, removing the reference to the table.
9. Follow steps 7 and 8 for the next table, but this time it is the transformation query for the new custom table. The logs shown are from the selected table (as the custom table does not exist yet!)
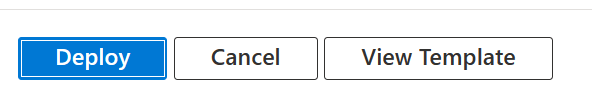
10. Now you should be ready to press the button “View or Deploy Template”. On the next page, you can select “View Template“. This will take you to the ARM deployment UI, and you can use this in your deployments, merge it with other templates or deploy from the UI.
I hope this helps simplify the process of splitting high and low value logs into analytic and basic log tables.
