- Link to GitHub Content: Azure Monitor Agent Deployment Report in GitHub
The Azure Monitor Agent (known as the AMA) was born out of the need to upgrade and modernize the now unsupported Microsoft Monitoring Agent. Deploying the Azure Monitor Agent should be a straightforward task in most organizations, but what happens when you want to monitor your environments coverage. Using Azure Policy would typically be the route I would recommend, but even then there is the complexity with different image types that do not support the agent, or require parameter overrides to deploy via policy.
What about understanding the different virtual machine types, whether it is deployed from the Azure marketplace, Azure Compute Gallery, an Azure Arc Virtual Machine or even attached images? It starts to get confusing.
This is where Power Bi comes in.
I have been using Power Bi more and more recently to create solutions to visuals and gather insights on data and a recent ask for help was to help understand the Azure Monitor Agent coverage, including identifying images that are not supported via the built in Azure policies.
This report aims to:
- Report on the current deployment state of the Azure Monitor Agent across Windows and Linux Operating system, whether they are an Azure virtual machine, Azure virtual machine scale sets or Azure Arc enabled server.
- Categorize the virtual machines by image type.
- Assess marketplace images to understand if they are supported by the built in policy or if additional configuration is needed.
What it doesn’t do:
- It does not tell you how to configure the policies, it just highlights the key information that you need to be aware of.
- It does not go into details about data collection rules or agent configuration, only the health state of the agent deployment.
- It does not auto update based when the new built in policies are updated (Not yet anyway)
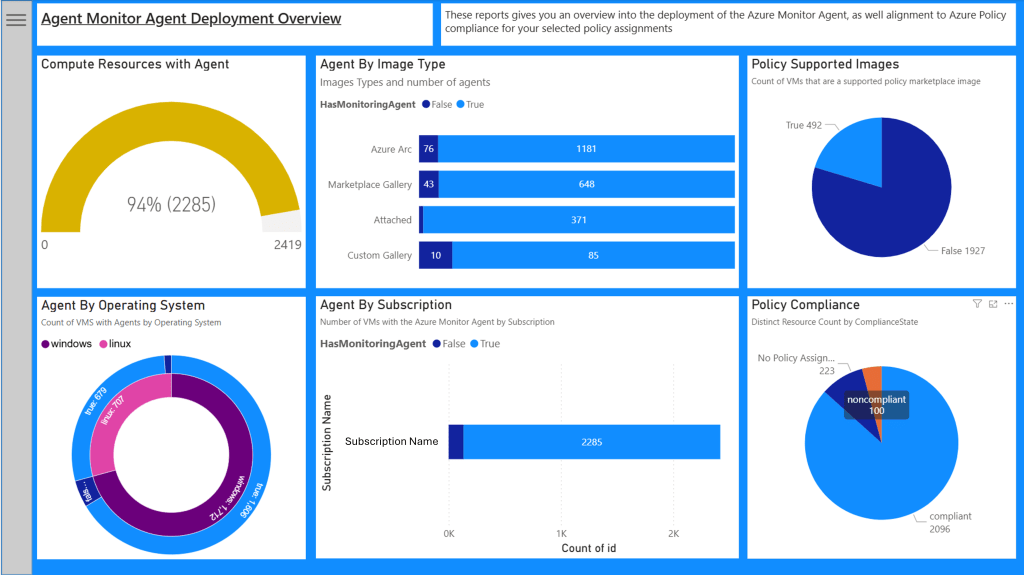
The Overview page
The overview page gives a high level view of your estate with the aim of showing you the Azure Monitor Agent deployment and Azure Policy compliance across the whole environment. All the visuals are across all tab are designed to be interactive, so by selecting an element on one will update the filters across all the other. This does not apply to the “Compute Resources with Agent” when filtering out the value “HasMonitoringAgent”, either via visual interaction or changing the parameters.
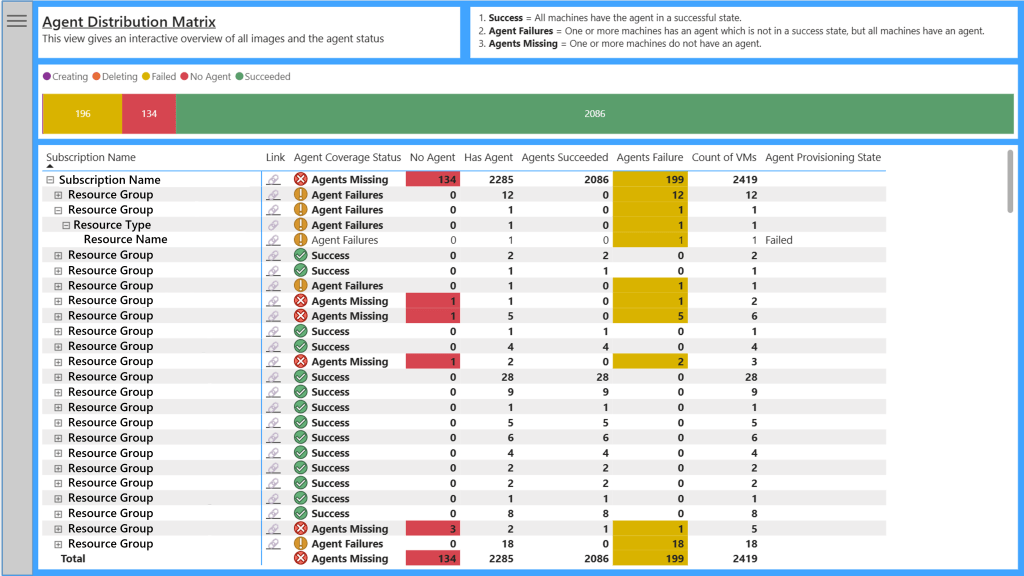
Agent Distribution Matrix Page
This report aims to shows the agent coverage across your subscriptions, with drill down capabilities to the resource level. The Agent Coverage Status provides a roll up status of the worst status.
- If all virtual machines within the scope have the Azure Monitor Agent in a successful provisioning state, then it will show “Success”.
- If one or more virtual machines within the scope is not in a successful provisioning state, but all virtual machines have the Azure Monitor Agent, then it will show as “Agent Failures”.
- If one or more virtual machines does not have the Azure Monitor Agent, the it will show “Agents Missing”.
It is worth noting that you can filter this data with parameter slicers, such as filtering certain resource types or operating systems.
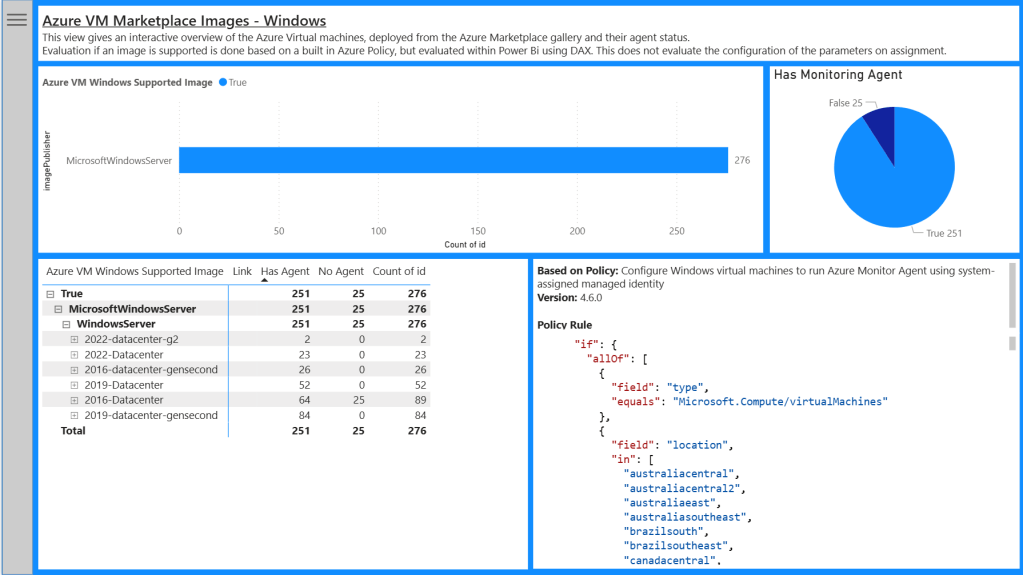
Windows / Linux Virtual Machines Marketplace images Report
These pages give you an interactive overview of Azure virtual machines which are deployed from the Azure Marketplace galley, as well as their agent status. It also incorporates a calculated column, which evaluates the virtual machine image and determines if it is supported by the Microsoft built in policies for the Azure Monitor Agent.
This helps identify all the images that require additional consideration. For example you may have deployed an Azure Marketplace image from a vendor where the operating system has been harden, or configured in such a way that no longer supports the Azure Monitor Agent. These reports is designed to help identify these scenarios.
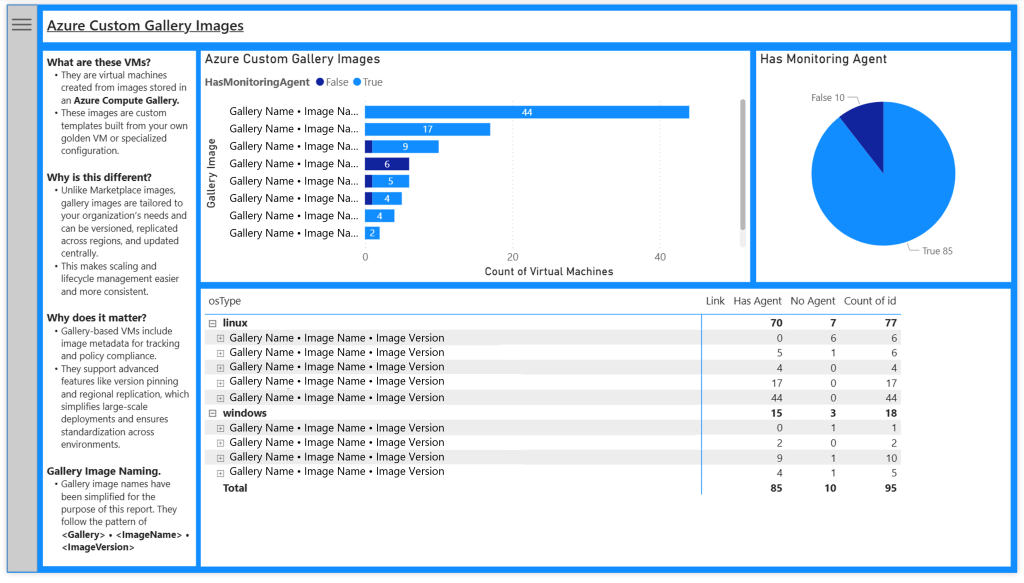
Azure Custom Image Gallery Report
Some organizations choose to create bespoke images for deployment within their environment. These are typically images created based on Azure Marketplace images, which then have applications installed and configured to meet the business specifications. These images are supported by the Microsoft built in policy in the same way as the Azure Marketplace images, but typically need to be declared in a parameter, either by adding the image id or overriding evaluating supported images. Which ever method you choose, this helps identify the Azure Monitor agent distribution across Azure Compute Gallery images.
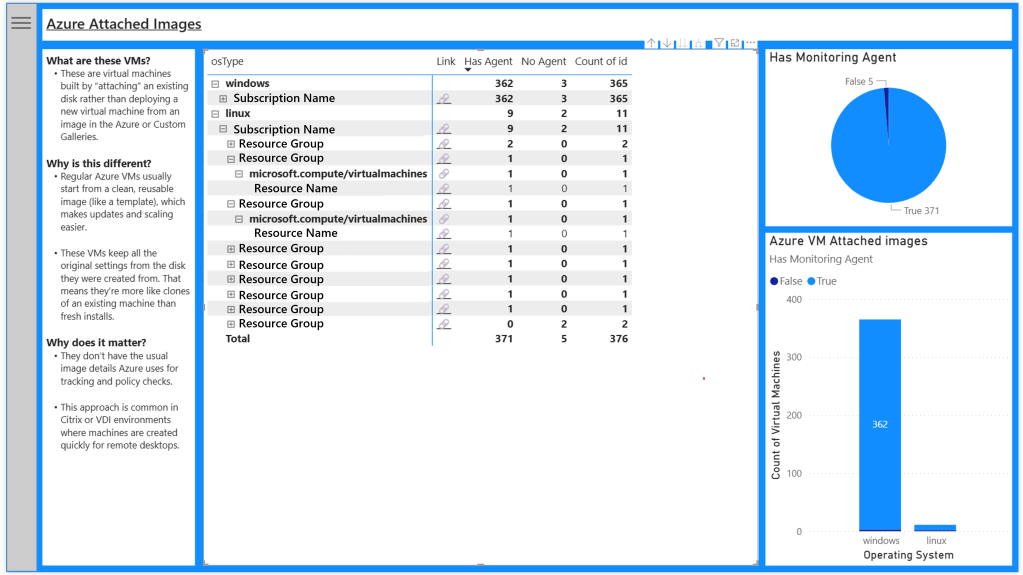
Azure Attached Images Report
There are scenarios where the virtual machines do not have an image id or image SKU information, like those deployed from the Azure Marketplace or Azure Compute Gallery. These may have been provisioned via Azure Migrate services or virtual desktop solutions such as Citrix, where an existing image is mounted and used for the duration of the virtual machines life.
Azure Arc Machines
Running the Azure Monitor Agent outside of Azure requires the Azure Arc Agent. This agent manages deployment, configuration and authentication of the Azure Monitor Agent, as well as many more Azure services extending into on-premises other private and public clouds. It is worth noting that this will only show agents AFTER the Azure Arc agent has been deployed, otherwise Azure has no visibility.

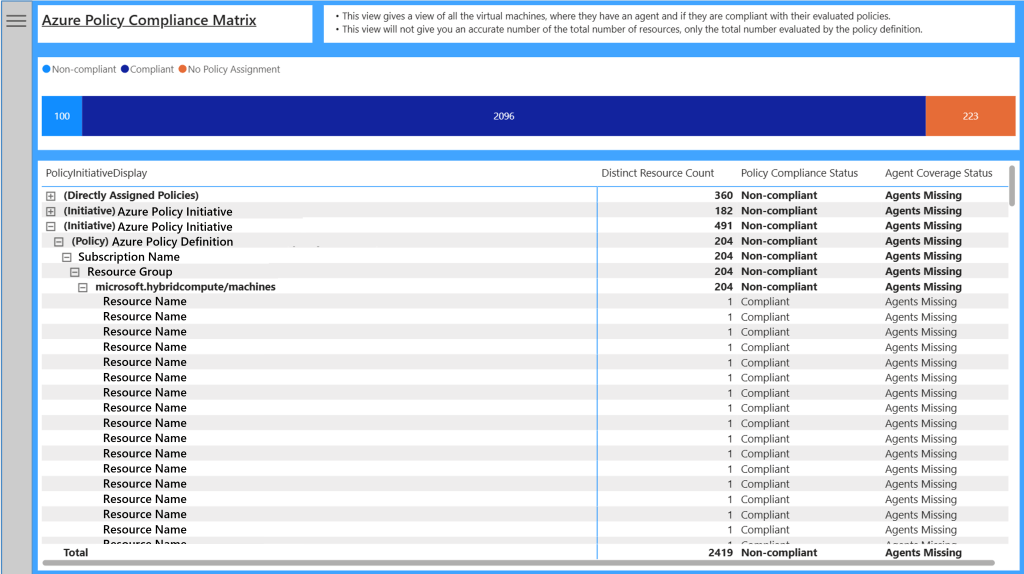
Azure Policy Compliance Matrix
Most of these reports have focused on the images and status of the Azure Monitor Agent. The Azure Policy Compliance Matrix focuses on policies and initiatives that have been deployed within your environment and their compliance status. This only reports on policies that have “AzureMonitorWindowsAgent” or “AzureMonitorLinuxAgent” within the policy rule. It will capture any policy that is assigned and contains one of these strings, regardless of the policy effect.
This report will show the agent coverage, as well as the Azure Policy Compliance status, with the added “No Policy Assignment” to identify any machines that are not covered by a policy. It will help you find policies that are potentially miscofigured or need a remediation task running to deploy the agents.
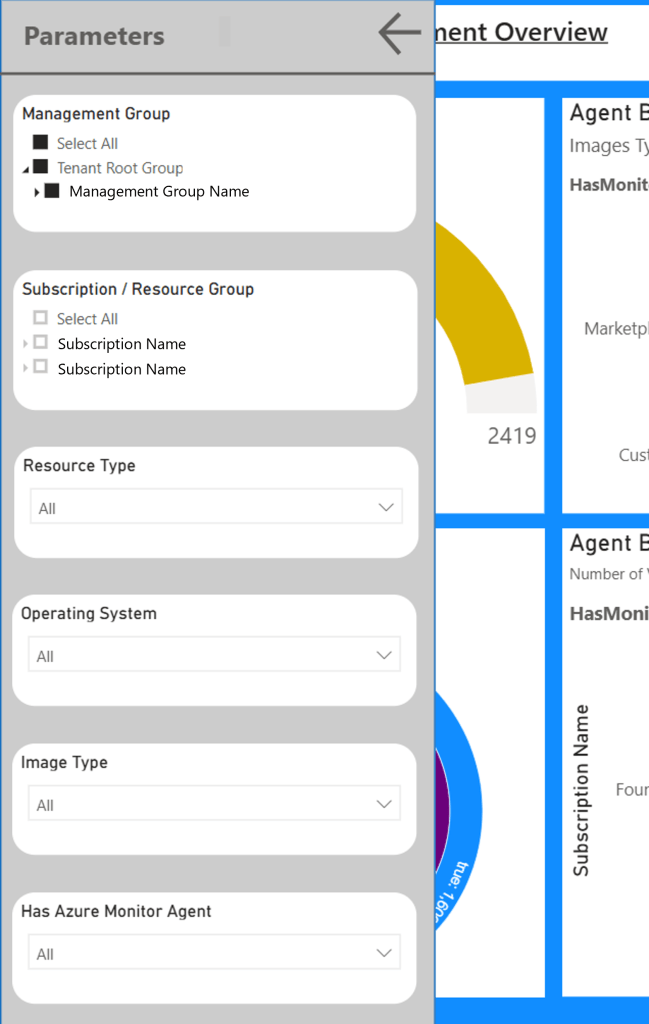
Slicers
When building these reports, each page had its own area for slicers. This was to make it easier to filter out unwanted data and focus in on the areas important to the user. As I continued developing the pages, these were taking up too much room.
In the upper left corner of each page is a menu icon (three horizontal lines stacked on top of each other). By clicking this icon, a parameter panel will fly out, allowing you to select filters that are relevant to the page you are on. These parameters can then be hidden using the “left arrow” in the top to collapse the panel, while preserving your selections.
Data Connector and Permissions
This report uses Azure Resource Graph as the data source for all your data, and a sources a lookup table from the Microsoft FinOps toolkit on GitHub. Azure Resource Graph is an Azure service designed to extend Azure Resource Management by providing efficient and performant resource exploration. Resource Graph has the ability to query at scale across a given set of subscriptions so that you can effectively govern your environment.
Within this report, the connector is scoped to the tenant, meaning it will run the query across all management groups and subscriptions. However the reality is that this is limited by the permissions of the account that is used to run this report. Also the data source has had result truncation disabled across all queries, meaning that it will return more than 1000 results per query. This is crucial for the report to work. I have tested this for over 10,000 machines, and it takes a few minutes to return all this data due to the API throttling. You can read more on this connector here.https://learn.microsoft.com/en-us/azure/governance/resource-graph/power-bi-connector-quickstart?tabs=power-bi-desktop
Because the data is queried via Azure Resource Graph API, the account which is used needs the ability to read the Virtual machines, Azure policy assignments, definitions and definition sets. I have tested this with the built in role reader at the tenant root management group.
Deployment
To maintain version control, I have decided to save this file as a Power Bi Project (Preview). For me this capability has been a long time coming as examining and interacting with Power Bi programatically, as well as maintaining version control has been something I have wanted for a while. To get started with the report
- Navigate to the Azure Monitor Agent Deployment Report in GitHub
- From GitHub, download the Azure Monitor Agent Deployment Report.zip file
- Extract the files to a location of your choosing
- Ensure you have Power Bi Desktop installed (free and downloadable from multiple sources, including the Microsoft Store)
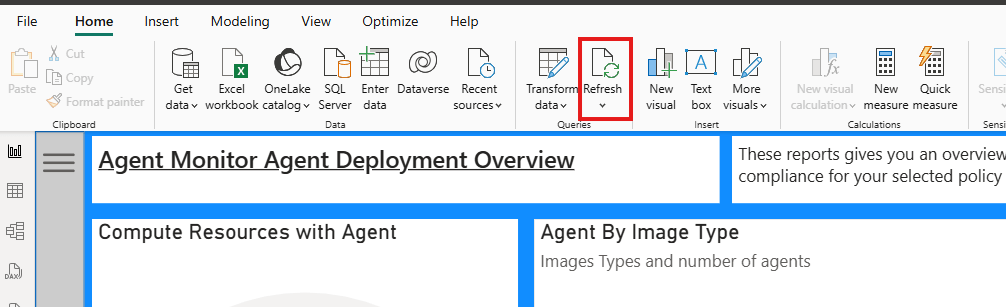
- Sign in with a work account which has read permissions over the entire Azure environment. I do this by simply clicking the refresh button and you should be prompted to sign in to Azure Resource Graph.
- Wait for the data to be populated
It is worth noting that if you sign in with an account that only has partial access to the environment, the policy display names may render as resource ids as you do not have direct permissions to read the policy and therefore are only accessing the policy state which is directly related to the virtual machines.
I am hoping this report helps you ensure you have a full and successful deployment of the Azure Monitor Agent across your entire environment. I would love any and all feedback so I can make the relevant improvements if needed, though I will caveat this with the point that the dashboards are designed to be functional and I am by no means a graphic designer 😂.
Alistair
